Recently I was tasked with implementing an interactive world map as part of a global resorts website. The artist’s Photoshop comps made the task somewhat easier because they used a vector image for the map. This was a necessity for my implementation, since I intended to use SVG. In a responsive layout there was no other choice.
In a fixed-size layout it would have been possible to simply use absolute positioning to overlay PNG images on a background and use an image map to create the links and the rollover effect. This won’t work in a responsive layout, because image maps don’t scale. They don’t scale because their hotspot coordinates are expressed in pixels. Theoretically you could use percentages for the hotspots, except no major browsers understand percentage coordinates correctly, and all interpret percentage coordinates as pixel coordinates.
Drawing coordinates with SVG is the same amount of code, but unlike an image map SVG coordinates automatically scale to the parent dimensions.
Building the SVG
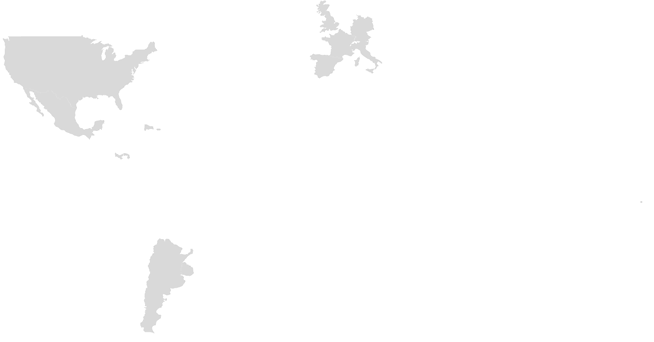
If I were doing a small map with simplified regional shapes I would have done the map entirely in SVG. However the map I was given was of the entire world and had an extreme amount of detail. Those details translated into additional coordinates, which would have greatly bulked up my file size, weighing in at 532k. I could not simplify them with Illustrator without losing the look of the map. Instead I made it an 8-bit PNG, at the largest dimensions I would need. It was 1476 × 723 and weighted 26k. I erased some of the smaller islands because they added unnecessary clutter and looked like dirt, rather than detail.
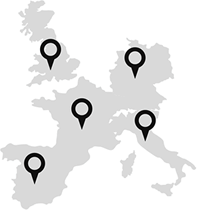
Next, I selected only the countries that would be active from my vector map and hid the rest. I didn’t delete them because I may need to add them back later as the client adds new resorts, and hidden layers don’t get included in the SVG export, so they won’t bulk up my file size. I ended up with a vector drawing that looked like this:
I placed the geo indicators (vector graphics) where I needed them. I grouped each indicator with its country. The grouping is important, as SVG exports by layers, and I needed the indicators to be on the same layer as their countries for the rollover action:
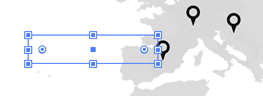
I placed a rectangle on my map to act as an extension of the rollover state. Since on most of the countries the rollover text won’t fit on the country itself it must be placed outside the bounds of the country. That means you will loose the rollover when you try to get to it. The rectangle keeps the text contiguous with the country. I also used it to enlarge the active area on the smaller countries.
I could also have added the text for each country name to the SVG in Illustrator and group it with the country, but I chose not to do this. Illustrator gives two export options for text: Outlined text (vectors) or SVG. Vectors would not have allowed me to easily edit the text later, for example if I needed a version of the map in Spanish. The SVG export option wasn’t much better. Due to the way Illustrator handles text, the SVG output looked like this:
<text xmlns="http://www.w3.org/2000/svg" class="cls-6" transform="translate(1778.94 265.36)">
<tspan class="cls-7">F</tspan>
<tspan x="27.66" y="0">r</tspan>
<tspan x="46.98" y="0">an</tspan>
<tspan x="109.2" y="0">c</tspan>
<tspan x="135.72" y="0">e</tspan>
</text>
Technically, it was editable, but not easily. Instead, I decided to add my text after export to the SVG. Here is what the export pane looks like for Illustrator. (The “Font” setting is selected, but since there is no font on in my graphic it will not matter.)
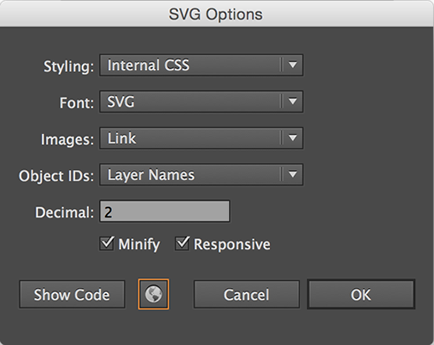
I chose “Internal CSS” because my other choices were to have it inline with each element, which would have made it impossible to style all identical elements at the same time. I also chose to link my PNG file (the map background image) because otherwise it would have been embedded as a data URI. I think given the size of the PNG and the below-the-fold placement of my map this is a better choice in this case. Notice the globe icon with the orange square around it in the above image. Clicking this opens your SVG in the browser. From there, you can copy the entire implementation and paste it into your HTML page. You can also use the “Show Code” option, which will output it as a text document. You’re going to need one or the other, because editing will be required for the rollover states. You can use any text editor for this.
Editing the SVG
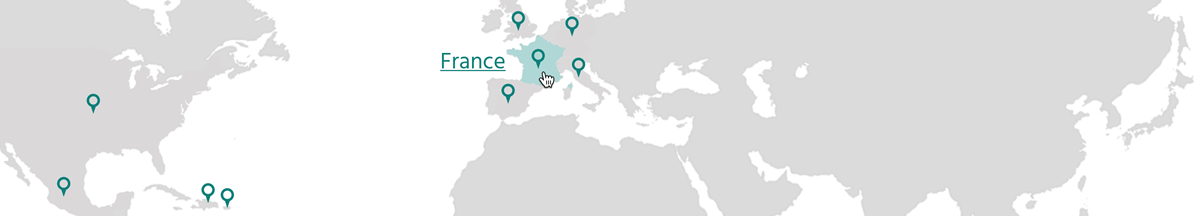
The artist’s vision required that when the user rolls over a country the name will show as a hyperlink that the user can click to go to a detail page for that country. This is done by adding text elements to the SVG and wrapping everything in a link. I position the text using x and y coordinates that I derive from the rectangle I put in earlier. My text position doesn’t exactly match my rectangle, but the adjustment was simple:
<a xlink:href="/france.html">
<path class="resort" >[SVG for country] />
<path class="geo-ind">[SVG for indicator] />
<rect x="746" y="104" width="170" height="45"></rect>
<text class="title" x="765" y="137">France</text>
</a>
I took the <style> block out of the SVG and added it to my external CSS, then I placed the SVG inside a parent set to scalable width, for example 100%. The SVG will scale with that parent, making it responsive. I completed the implementation by adding a hover state to my CSS and adjusting the colors (fills) of the SVG paths. Below is the final result: